First and foremost, our thoughts and prayers go out to all those affected by last weeks storms in the Southeast. We sincerely hope everyone finds a way to safely navigate through the aftermath. Please take a moment to click the link below to donate to a relief fund to provide aid to those in need.
Trick or Treat?
That is the question most of us in the industry are asking ourselves about what the next few months of this year have in store for us.
Here are just a few of the bigger questions out there…
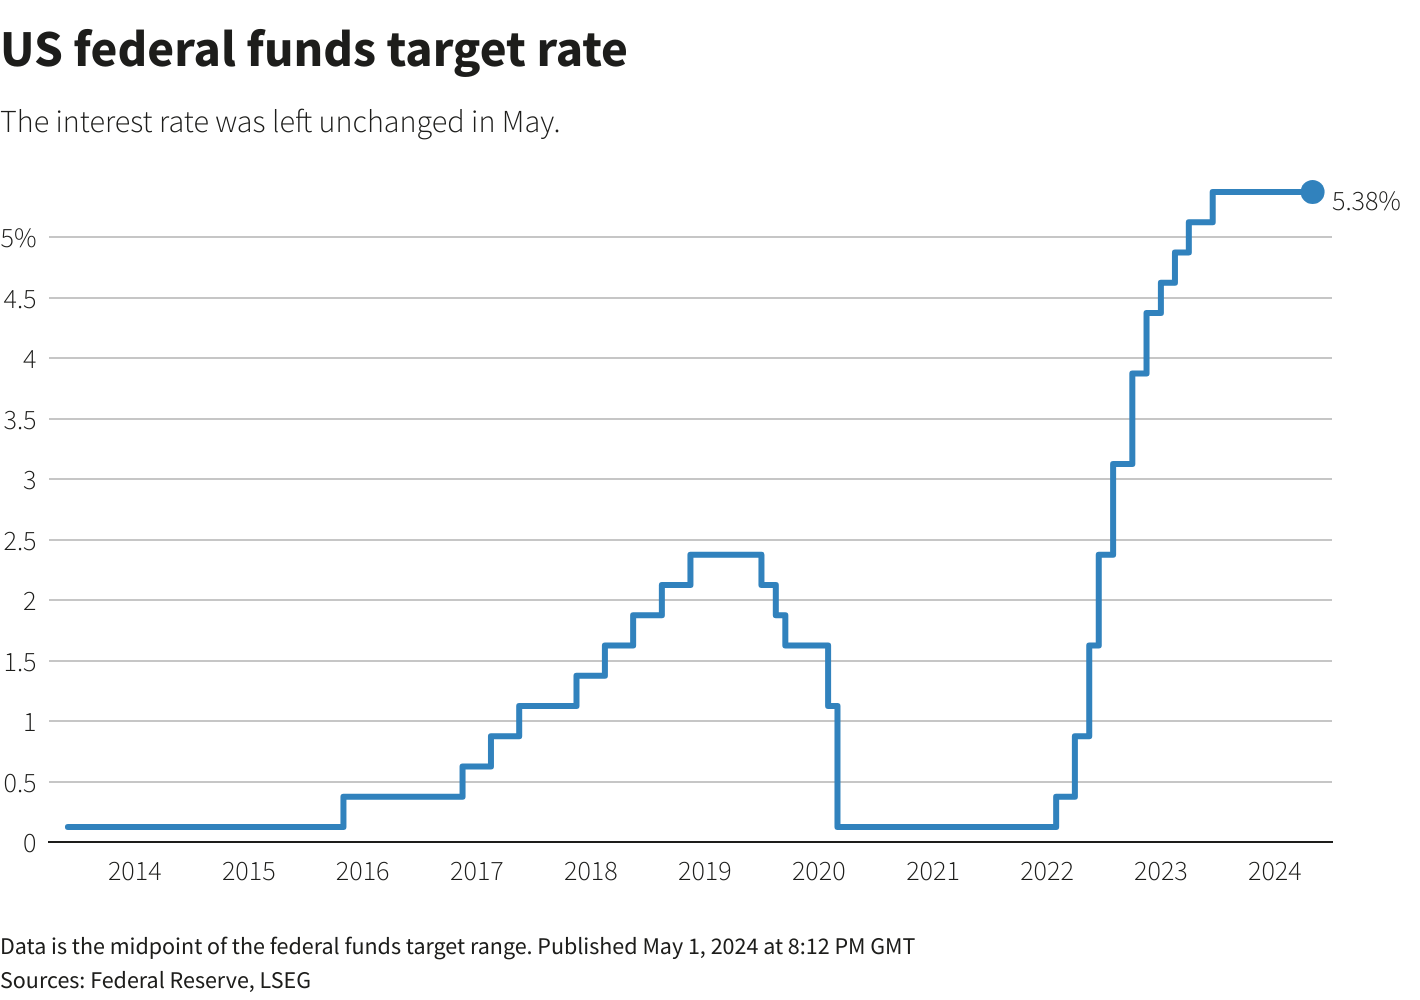
Will the interest rate cuts accelerate, or slow car sales?
Will the election breed confidence or fear into the markets?
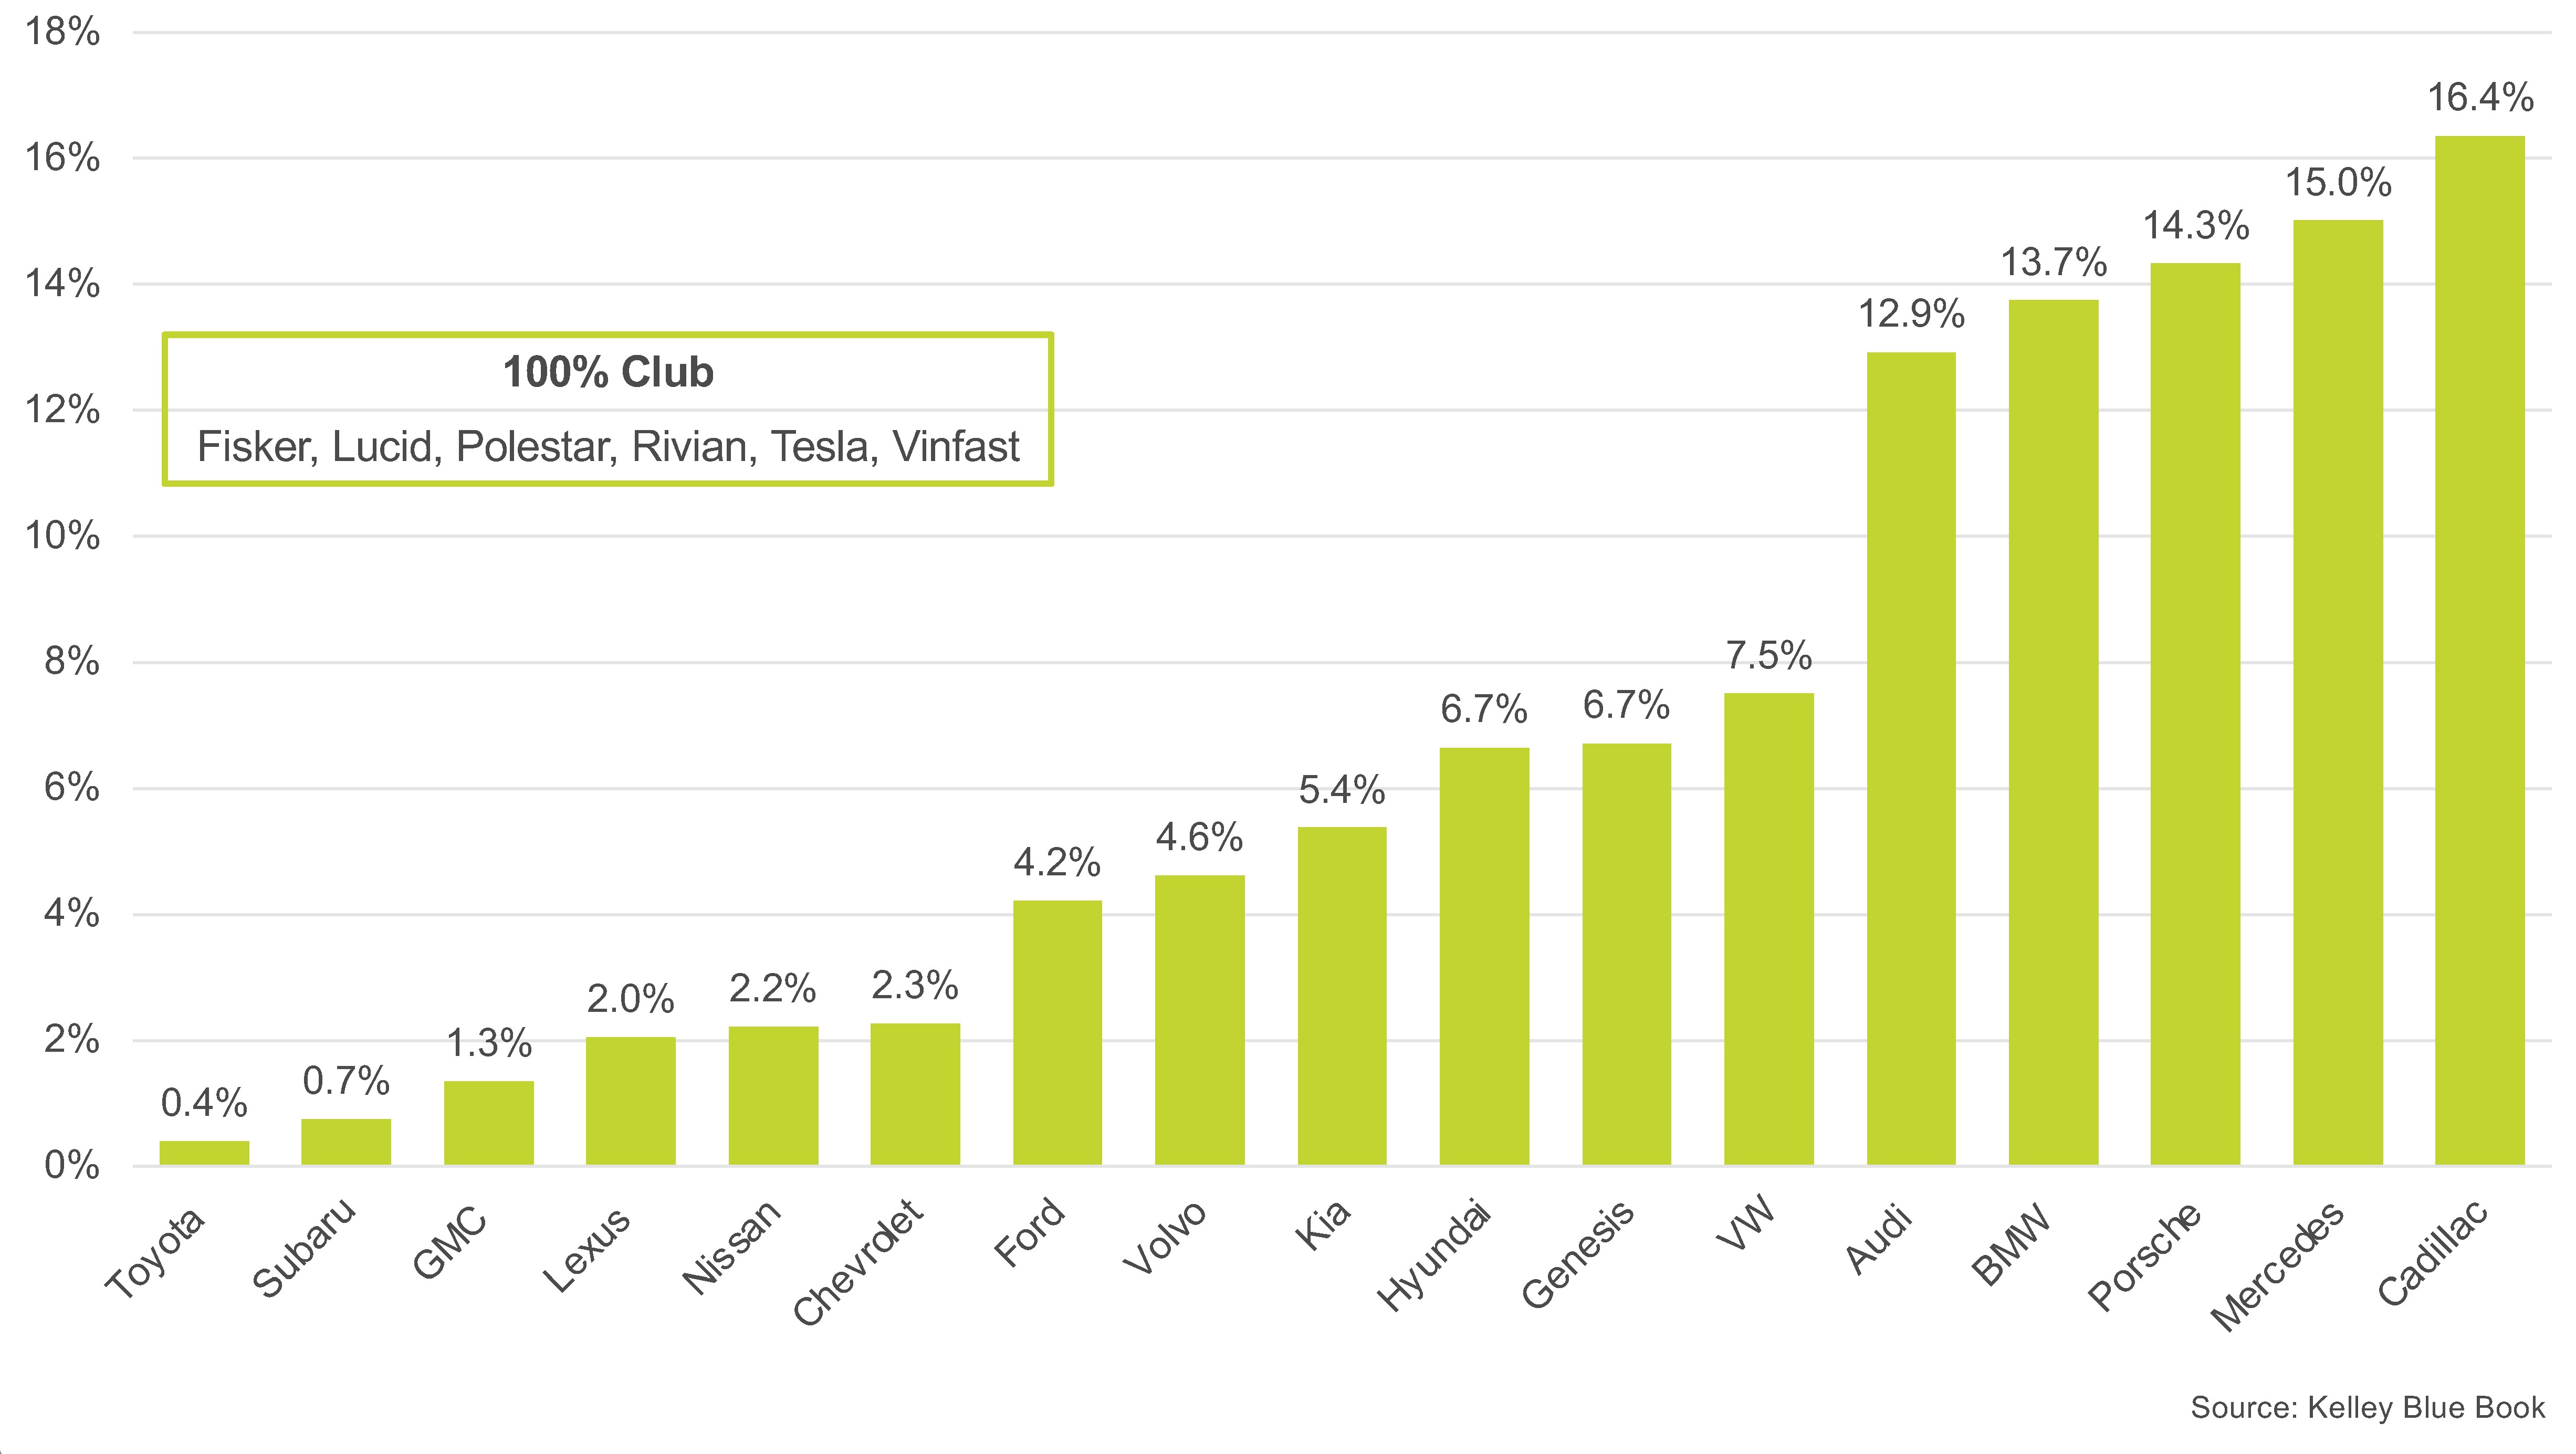
Will the juxtaposition on EV’s cause more manufactures to transition away from the segment?
Will the market look more reasonable in terms of Blue Sky in 2025?
What is the turnaround time for Stellantis?
All of these are good, legitimate questions and depending on how they are answered could drastically change how the industry’s future unfolds.
As our team crisscrosses the country speaking with dealers and other industry leaders, one thing we have learned for sure; we are past the COVID days of volume and profits. Dealers are working to find new ways to add gross profit, new ways to compete for customers, and new ways to train (and in some cases, retrain) their staff. The good news is, we at ADS have the solutions.
Even though the industry has seen decreases in F&I profitability, our dealers are still holding strong, and even seeing increases. Our dealers are adding Repaired Forever (see below) as a new profit center to their dealerships, and are utilizing ADS and its decades of retail experience to help their teams continue to grow and thrive!
Here are just a few of the bigger questions out there…
Will the interest rate cuts accelerate, or slow car sales?
Will the election breed confidence or fear into the markets?
Will the juxtaposition on EV’s cause more manufactures to transition away from the segment?
Will the market look more reasonable in terms of Blue Sky in 2025?
What is the turnaround time for Stellantis?
All of these are good, legitimate questions and depending on how they are answered could drastically change how the industry’s future unfolds.
As our team crisscrosses the country speaking with dealers and other industry leaders, one thing we have learned for sure; we are past the COVID days of volume and profits. Dealers are working to find new ways to add gross profit, new ways to compete for customers, and new ways to train (and in some cases, retrain) their staff. The good news is, we at ADS have the solutions.
Even though the industry has seen decreases in F&I profitability, our dealers are still holding strong, and even seeing increases. Our dealers are adding Repaired Forever (see below) as a new profit center to their dealerships, and are utilizing ADS and its decades of retail experience to help their teams continue to grow and thrive!
Good luck and good selling to all of you!
Sincerely,
Bob and Ryan
IN THE NEWS
Why the Fed’s rate cut won’t immediately help car buyers or sales
Carmakers Scale Down Electrification Plans as EV Demand Slows
Jeep CEO enacts turnaround plan after significant sales declines
High interest rates, prices, continue to stall sales
Toyota cuts 2026 global EV output plans by a third, Nikkei reports
Predictions For 2025: Automakers Buckle Under Pressure From Consumers
EVENTS WE WILL BE ATTENDING
Live2Lead – https://www.eventbrite.com/e/live2lead-cleveland-tickets-937395323647?aff=oddtdtcreator
RVDA – https://www.rvda.org/Convention
F&I Product and Reinsurance Conference – https://www.fandi-conference.com/
View the full newsletter: https://mailchi.mp/advdealer.com/november-newsletter-4vmogzv35y-17464034